The Chicago School at Chicago vs. Albany College of Pharmacy and Health Sciences
The Chicago School at Chicago ranked #-1 and Albany College of Pharmacy and Health Sciences ranked #-1 in national university ranking. The following statements compare The Chicago School at Chicago and Albany College of Pharmacy and Health Sciences with important academic statistics including tuition, test scores, and admission rate.
- Both schools are private.
- Albany College of Pharmacy and Health Sciences's tuition ($40,025) is more expensive than The Chicago School at Chicago ($20,844).
- The Chicago School at Chicago's acceptance rate (33.33%) is lower than Albany College of Pharmacy and Health Sciences (59.08%).
- The Chicago School at Chicago has higher yield (11.11%) than Albany College of Pharmacy and Health Sciences (9.90%).
- Both schools have same SAT scores of 1,270.
- The Chicago School at Chicago's students to faculty ratio (8 to 1) is lower than Albany College of Pharmacy and Health Sciences (10 to 1).
- The Chicago School at Chicago (1,243 students) is larger than Albany College of Pharmacy and Health Sciences (875 students) with more enrolled students.
- Albany College of Pharmacy and Health Sciences ($20,853) has higher amount of financial aid than The Chicago School at Chicago ($7,237).
- Both schools have same graduation rate of 69%.
Offered Degrees
Bachelor's
Master's
Post-Graduate Certificate
Doctorate
Master's
Post-Graduate Certificate
Doctorate
Tuition & Fees
$20,844
Financial Aid
$7,237
Test Scores
Admission
33.33% Acceptance Rate
11.11% Yield
Enrollment
31 Undergraduate
1,212 Graduate
96 Online Students
Graduation Rate
Faculty & Staff
8 to 1 Students to Faculty
57 Faculties (full-time)
103 Staffs (full-time)
$76,085 Faculty Salary
$65,918 Staff Salary
Learning Opportunities
Study Abroad
Evening College
Evening College
Campus Living
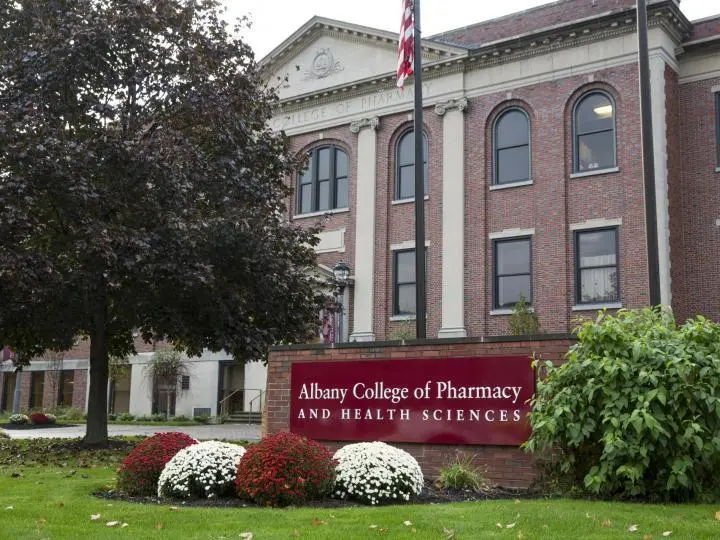
Albany College of Pharmacy and Health Sciences
Private, 4 years • Albany, NY #NY in New York more rivalsOffered Degrees
Bachelor's
Master's
Doctorate
Master's
Doctorate
Tuition & Fees
$40,025
Financial Aid
$20,853
Test Scores
1,270 SAT
31 ACT
Admission
59.08% Acceptance Rate
9.90% Yield
Enrollment
547 Undergraduate
328 Graduate
Graduation Rate
69% Graduation Rate
86% Retention Rate
Faculty & Staff
10 to 1 Students to Faculty
71 Faculties (full-time)
198 Staffs (full-time)
$86,042 Faculty Salary
$73,641 Staff Salary
Learning Opportunities
ROTC
Study Abroad
Study Abroad
Campus Living
Campus Housing Offered
-$7,000 annual charge
-555 capacity
Add a College
Add a College
Add a College
More rivals of The Chicago School at Chicago
- vs. Inter American University of Puerto Rico-Central Office
- vs. Yeshivath Zichron Moshe
- vs. Rasmussen University-Wisconsin
- vs. Galen College of Nursing-Cincinnati
- vs. Yeshiva Karlin Stolin
- vs. Grace Mission University
- vs. Southwestern Christian University
- vs. Rocky Mountain College of Art and Design
- vs. California Jazz Conservatory
- vs. University of Maine-System Central Office
- vs. Saint Vladimirs Orthodox Theological Seminary
- vs. Meadville Theological School of Lombard College
- vs. Austin Community College District
- vs. The Continents States University
- vs. Ecumenical Theological Seminary
More rivals of Albany College of Pharmacy and Health Sciences
- vs. Pacific Northwest College of Art
- vs. University of Hawaii Maui College
- vs. Brescia University
- vs. NUC University
- vs. Boricua College
- vs. Newberry College
- vs. Johnson & Wales University-Charlotte
- vs. Alabama College of Osteopathic Medicine
- vs. West Coast University-Orange County
- vs. Sterling College
- vs. University of Nebraska-Central Administration System Office
- vs. Walla Walla Community College
- vs. Wisconsin School of Professional Psychology
- vs. Yeshiva D'monsey Rabbinical College
- vs. American College of Healthcare Sciences