BU vs. Franklin W Olin College of Engineering
Both Boston University and Franklin W Olin College of Engineering are Private, 4 years schools located in Massachusetts. The following statements compare Boston University and Franklin W Olin College of Engineering with important academic statistics including tuition, test scores, and admission rate.
- Both schools are private.
- BU's tuition ($65,168) is more expensive than Franklin W Olin College of Engineering ($61,802).
- BU's acceptance rate (10.85%) is lower than Franklin W Olin College of Engineering (21.66%).
- Franklin W Olin College of Engineering has higher yield (48.76%) than BU (36.01%).
- Franklin W Olin College of Engineering's SAT score (1,530) is higher than BU (1,470).
- Franklin W Olin College of Engineering's students to faculty ratio (8 to 1) is lower than BU (11 to 1).
- BU (36,714 students) is larger than Franklin W Olin College of Engineering (386 students) with more enrolled students.
- BU ($50,703) has higher amount of financial aid than Franklin W Olin College of Engineering ($39,949).
- Franklin W Olin College of Engineering's graduation rate (92%) is higher than BU (90%).
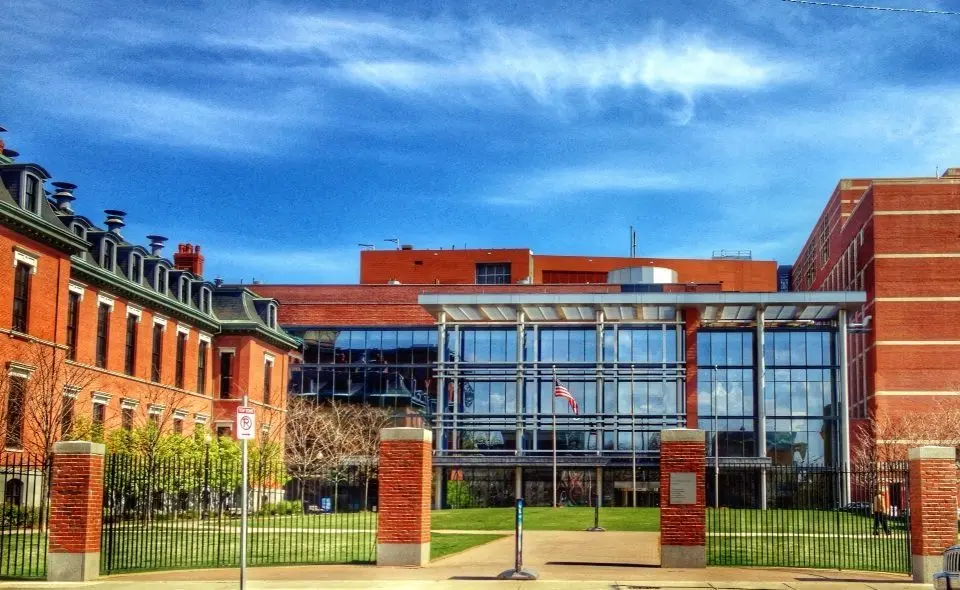
Boston University
Private, 4 years • Boston, MA #30 National Universities, #7 in Massachusetts more rivalsOffered Degrees
Certificate Programs
Bachelor's
Post-Graduate Certificate
Master's
Doctorate
Bachelor's
Post-Graduate Certificate
Master's
Doctorate
Tuition & Fees
$65,168
Financial Aid
$50,703
Test Scores
1,470 SAT
33 ACT
Admission
10.85% Acceptance Rate
36.01% Yield
Enrollment
18,459 Undergraduate
18,255 Graduate
4,044 Online Students
Graduation Rate
90% Graduation Rate
94% Retention Rate
Faculty & Staff
11 to 1 Students to Faculty
3,047 Faculties (full-time)
9,030 Staffs (full-time)
$136,930 Faculty Salary
$79,451 Staff Salary
Learning Opportunities
ROTC
Study Abroad
Evening College
Teacher Certificate
Study Abroad
Evening College
Teacher Certificate
Campus Living
Campus Housing Offered
-$11,600 annual charge
-11,767 capacity
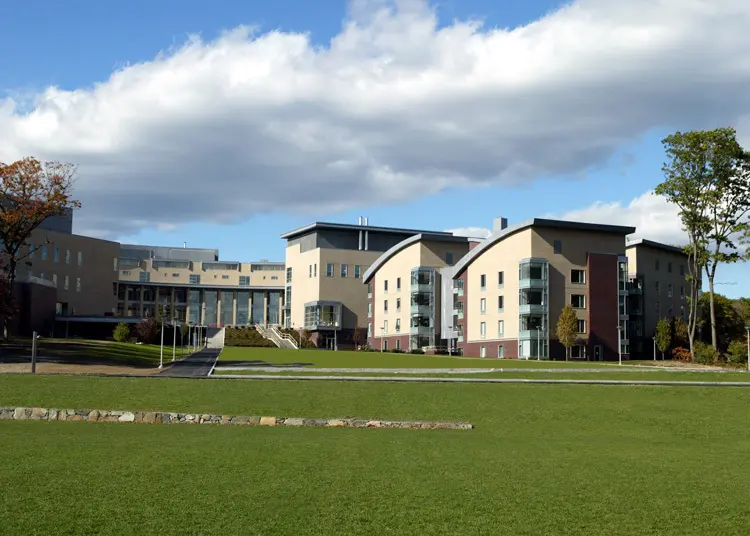
Franklin W Olin College of Engineering
Private, 4 years • Needham, MA #MA in Massachusetts more rivalsOffered Degrees
Bachelor's
Tuition & Fees
$61,802
Financial Aid
$39,949
Test Scores
1,530 SAT
35 ACT
Admission
21.66% Acceptance Rate
48.76% Yield
Enrollment
386 (All undergraduate)
Graduation Rate
92% Graduation Rate
99% Retention Rate
Faculty & Staff
8 to 1 Students to Faculty
47 Faculties (full-time)
124 Staffs (full-time)
$114,052 Faculty Salary
$110,157 Staff Salary
Learning Opportunities
Study Abroad
Campus Living
Campus Housing Offered
-$11,738 annual charge
-366 capacity
Board/Meal Plan Offered
-$8,082 annual charge
Add a College
Add a College
Add a College
More rivals of BU
- vs. Georgia Institute of Technology-Main Campus
- vs. Principia College
- vs. Brigham Young University
- vs. University of Virginia-Main Campus
- vs. Haverford College
- vs. Washington and Lee University
- vs. Grinnell College
- vs. The University of Texas at Austin
- vs. Tulane University of Louisiana
- vs. University of Florida
- vs. Middlebury College
- vs. Carleton College
- vs. Middlebury Institute of International Studies at Monterey
- vs. University of North Carolina at Chapel Hill
- vs. Emory University
More rivals of Franklin W Olin College of Engineering
- vs. Berklee College of Music
- vs. Saint John's Seminary
- vs. Northeastern University Professional Programs
- vs. Lesley University
- vs. Worcester State University
- vs. University of Phoenix-Massachusetts
- vs. Dean College
- vs. Bridgewater State University
- vs. Becker College
- vs. Gordon-Conwell Theological Seminary
- vs. University of Massachusetts-Boston
- vs. Suffolk University
- vs. Boston Architectural College
- vs. Gordon College
- vs. University of Massachusetts-Central Office